Warning: This is an older blog post. I am including it just for posterity, and in the interest of just keeping all my old writing from my “earlier” days.
I’ve been tinkering on a submission to the Sense Your City competition hosted by Data Canvas. I hope I got the attributions right. It seems to be some Swissnex data art challenge, the ultimate goal of which is not entirely clear. Nevertheless, I thought that the data was potentially interesting - or at least fun to play with. Plus, it was an easy break from coding for Skyrise all day.

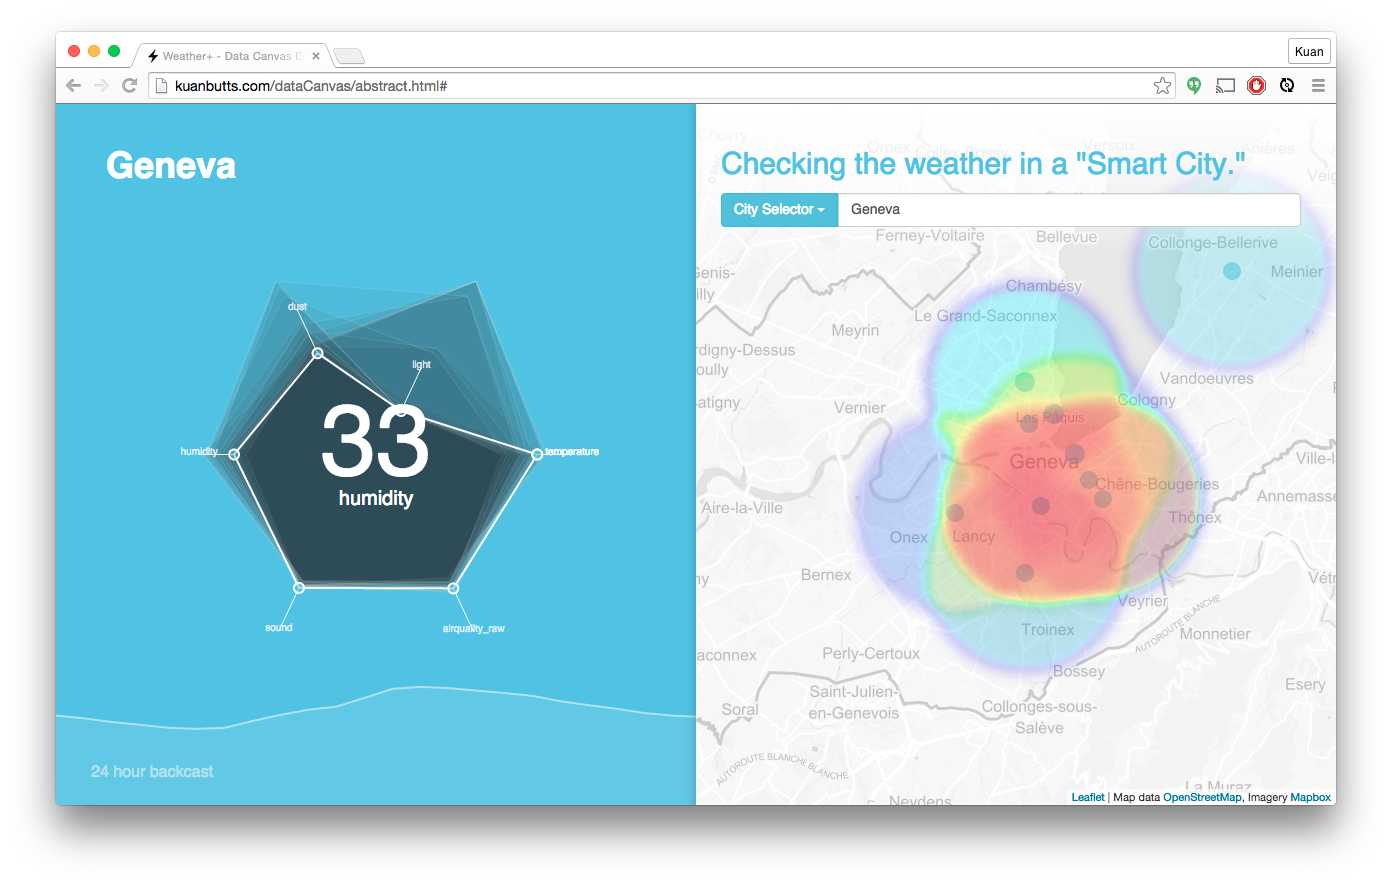
My final product is called “Weather+” and you can check it out here. Github guts for the project can be found here, as well.
Without getting too heady on the idea, the basic concept is that, in the future, you get all of these environmental factors that you care about besides the weather. In fact, today, we have this with humidity and the like. The goal was simply to allow one to explore each of these aspects on a single object. By rolling the cursor to the different corners of the hexagon, they toggle the different variables being measured. Because, in theory, ubiquitous sensors would allow for a more granular approach, the result of rolling over a variable would also render a map that would sort of be like a more zoomed in regional weather map. This I have created with a heat map on the right side that visualizes that variable geospatially. Credit for that component of the mini tool goes to Daniel Palencia, who helped me on this.