This is intended to just be a brief post regarding the quality of the data being produced from the MTA’s live feed of bus locations. While working with the data, I have encountered some issues with regards to the consistency of the bread crumbs (the last uploaded location of the vehicle).
Specifically, it seems that, occasionally, there are “dead” periods during which no data is uploaded to the vehicle. Furthermore, assembling a complete trip does not seem to be an easy task. Currently, I am running SQL queries against Nathan9’s (see his Github here) closed database where he has been accumulating MTA’s live data feed for some time. With this data set, I had hoped to easily produce shapes of each bus line.
Before we continue, some brief background, though. In 2010, I believe it was, the MTA released some GIS data regarding their system. This included a shapefile of all known bus locations. While useful (along with having been updated at least once in the intervening years), it has never been paired with a shapefile of the bus routes themselves. (If I am somehow wrong about this, please contact me immediately as I would love to know where that resource is - as of yet, it appears to not exist). As a result of this limitation, I set about creating the shapes myself.
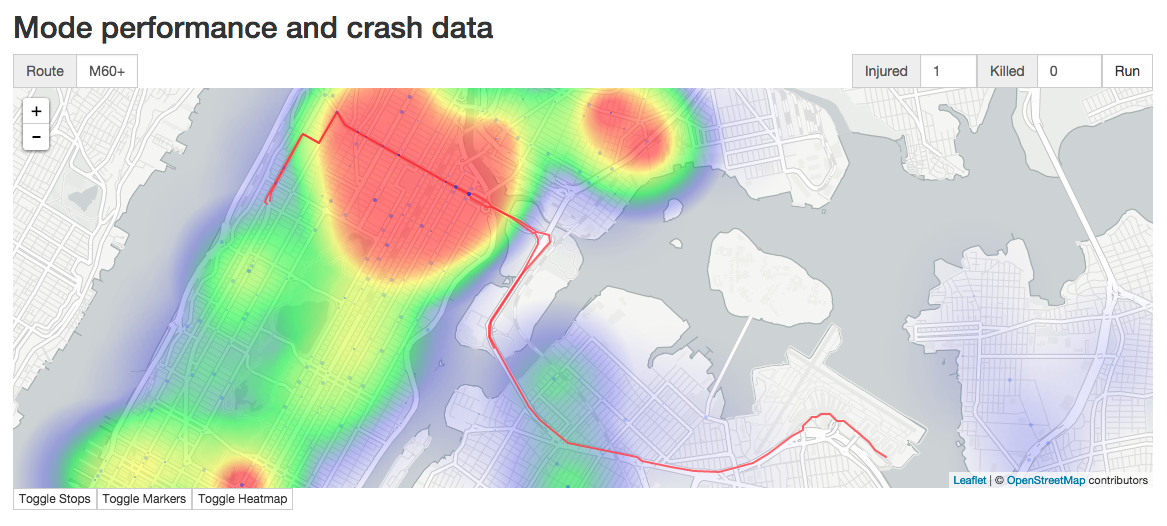
My goal in doing so is for a tool I will hopefully write a blog post about later. In general, though, the desire is to include a GeoJSON of a detailed path of both directions of any selected bus route. Here’s a quick screen grab of the current interface to get an idea of what is going on:
The SQL query is submitted via variable query, which is assembled as in the below, where route is a body paramter submitted during the AJAX call from the client, specifying which route (e.g., the M60+) to query for. Without supplying a LIMIT parameter, I am able to receive all of Nathan9’s scrapes from the MTA (which is a consistent database of all data released, starting from August of 2014).
var query = "SELECT shapes.*, trips.* FROM shapes JOIN trips ON shapes.shape_index = trips.shape_index WHERE route_id = '" + route + "' AND trips.feed_index > 25";As you can see, I join two feed tables, that of trips and that of shapes on their shared shape_index value, which references the breadcrumbs for a specific route. Combining the two results in all the column values associated with breadcrumbed data from the MTA that are published via their live stream. While not the most efficient query, it is effective for the purposes of having the flexibility to play with the resulting data in the node application. In addition, implementing a 50,000 row limit on the query resulting in fraction-of-a-second responses that made iteration quick and easy.
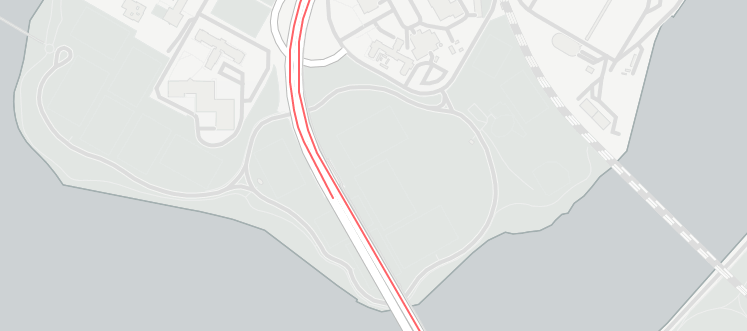
In red is shown the resulting GeoJSON of the M60 route from LaGuardia to Harlem and Columbia University. In the below image, I have an enhanced screen capture of a segment of the route. In this enhanced segment you can see where a fracture has occurred. Throughout the route, it appears that similar situations occur. These breaks appear to correlate with a column value from the MTA called shape_pt_sequence. This shape point ID appears to be incremental and indicates subsequent breadcrumbs.
The problem is, often, these are only a dozen or so “breadcrumbs” long. In the example of the M60+ route, the lowest valued integer for this column is 10001, with subsequent rows incrementing to a mere 10014 before “leaping” to 20000. There is a second column that I thought would also be of assistance (titled trip_index). Attempting to utilize this column was equally as futile as results from plotting just a single trip_index resulted in only sections of the route being drawn. That is, trip_index apparently could not be relied on to produce a single complete trip in either direction. Unfortunately, I have not been able to find documentation on the relationship between these two column values either, though I am in the process of reaching out to other individuals who have had some experience working with these values as well.
As a result, I’ve found it necessary to ignore both of these columns and set about attempting to concat all the resulting values locational values through some quick, on-the-fly logic. The general thought was that the shape_pt_sequence values were just enough to determine order and, once those were ordered, so long as the following shape_pt_sequence spatial point was not greater than an arbitrary distance (I am currently employing 500 meters via a quick and dirty distance algorithm adapted from this blog post), then it was added to the “current” line to be drawn.
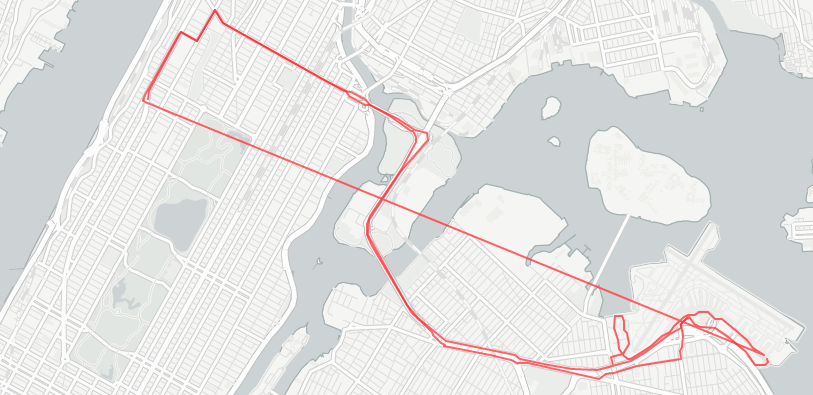
This avoided the problem that occurred when simply trying to line up all the subsequent shape_pt_sequence points in a row (or array). Specifically, the subsequent uploads are not organized along the route of the route. The difficulty that results here is that each segment can’t be automatically connected to the following. Doing so results in a zig zag of random connecting vectors, worsening the legibility of the output (see the below image for an example).
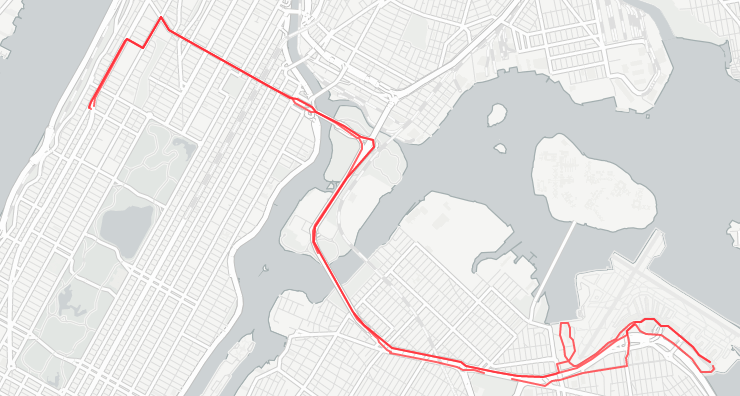
As a result, I’ve created a temporary solution that involves basically clumps what seem like a logical set of points that are each near the prior into single GeoJSON LineString features and am able to plot the results with a desired, legible effect. An example output is shown below. Also, the code can be viewed under this GH repo at the app.post for the '/sql/route' endpoint.
I’ve started a discussion on the MTA Developers Google Group with regards to my questions. There, I have framed both my confusion with regards to the way the data is published as well as have asked for comments with regards to accessing decent shapefiles. Should the conversation die or not be fruitful, I think my next step will be to create a tool for producing decent shapefiles of each bus line myself, and then set about publishing that. Finally, for reference, here is the full app.post method for this endpoint at the time of publishing. (It will likely change so please reference the GH link for the latest; this is purely for reference to understand the general gist for how the resulting data was cleaned).
app.post('/sql/route', function (req, res) {
	var route = req.body.route;
	console.log('Received MySQL request for route: ', route);
	var query = "SELECT shapes.*, trips.* FROM shapes JOIN trips ON shapes.shape_index = trips.shape_index WHERE route_id = '" + route + "' AND trips.feed_index > 25";
	query = query + " LIMIT " + socrata.limit + " ;";
	connection.query(query, function (error, rows, fields) {
		console.log('Completed MySQL request for route: ', route);
		if (!error) {
      var pointlist = {};
      rows.forEach(function (point) {
        var id = point.shape_id;
        if (!pointlist.hasOwnProperty(id)) {
          pointlist[id] = {};
        }
        if (!pointlist[id].hasOwnProperty(point.direction_id)) {
          pointlist[id][point.direction_id] = [point];
        } else {
          var ti = pointlist[id][point.direction_id][0].trip_index;
          var cr = point.trip_index;
          if (ti == cr && (point.direction_id == 0 || point.direction_id == 1)) {
            pointlist[id][point.direction_id].push(point);
          }
        }
      });

      // currently I roll everything into one trip in each direction

      var sel = {0: [], 1:[]};
      for (id in pointlist) {
      	var rt = pointlist[id];
      	if (Array.isArray(rt[0]) && rt[0].length > 0) { sel[0] = sel[0].concat(rt[0]); }
      	if (Array.isArray(rt[1]) && rt[1].length > 0) { sel[1] = sel[1].concat(rt[1]); }
      }

      // then I clean the results of the merge(s)

      for (n in [0, 1]) {
				for (var i = 0; i < sel[n].length;  i++) {
					if (sel[n][i] == null || sel[n][i] == undefined || typeof sel[n][i] !== 'object') {
						sel[n].splice(i, 1);
					}
				}
			}

			// use distance measure to determine if sae trip for breadcrumbs

			var broken = {0: [], 1:[]};
      for (n in [0, 1]) {
      	var trip = [];
				for (var i = 0; i < sel[n].length;  i++) {
					if (i > 0) {
						var prior = sel[n][i-1],
								current = sel[n][i];
						var result = distance(current.shape_pt_lat, current.shape_pt_lon, prior.shape_pt_lat, prior.shape_pt_lon);
						if (result < 500 && i !== sel[n].length - 1) {
							trip.push(sel[n][i]);
						} else {
							broken[n].push(trip);
							trip = [];
							trip.push(sel[n][i]);
						}
					} else {
						trip.push(sel[n][i]);
					}
				}
			}

			res.status(200).send({pointlist: broken})
		} else {
			res.status(500).send({error: error})
		}
	});
});