I’ve been trying to create a tool that can receive an unsorted blob or “cloud” of latitude/longitude data and infer a route from it. The use case from which the development of this tool was inspired is the processing of an array of GPS coordinates from a vehicle retracing a route multiple times. Essentially, I want to be able to merge a number of trips together, handling the fact that some trips may not be the complete route while others are. In addition, although I have been working with MTA data in NYC, I want to require as little data as possible to make the tool adnostic in terms of who is providing the data. By relying solely on the latitudinal and longitudinal values, I hope to create a tool that can be easily incorporated into other toolkits and prcesses related to a variety of data sources, rather than tying to a specific provider’s associated metadata that is published with their geospatial breadcrumbs.
With this array of points, I want to prune duplicate or too-near points (points within 5 meters of another point, I’ve arbitrarily chosen for the purposes of this exercise, though this is customizable naturally) and resort the following points to create a path. I want that path to be the “most-likely” correct path. That is, I want the points to form a path that is not erratic, and handles “turns” (rounding corners), without getting confused (and thus confoudning what would be a correct or reasonable order of points). Thus, there needs to be the logic in place to handle such twists and turns to follow a path that leads up to and around one correctly. Because there is no structure to the array as it is initially presented the list of spatial points can be arranged in any order. The tool should be able to reorganize the routes successfully and consistently.
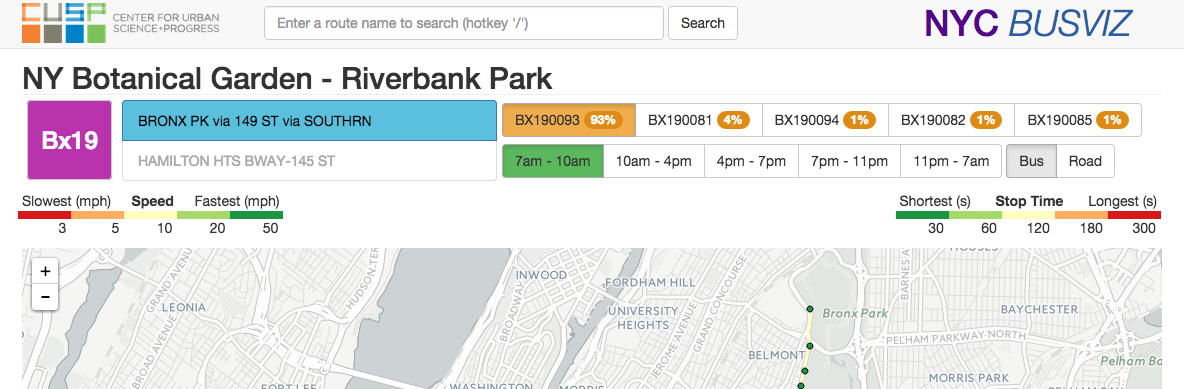
What is the purpose of creating this tool? The MTA, in New York City, publishes bus data in GTFS format (like many, many other municipal transit institions around the world). In the shapes.txt file that comes in a standard GTFS format, there is supposed to be just one shape file associated with a given route. In the case of the MTA’s published data, there are multiple shapes associated with a single bus line. From what I can tell, each shape appears to be related to one route the bus has taken. On a great site that is an NYU CUSP project, BusVis (shown in the above screen capture), if you look on the right hand side there is, highlighted in orange, a button named BX190093 that is selected. Next to it is a label indicating the value “93%.” This project, which was performed by students and a professor at CUSP has precalculated the frequency by which each shapefile (each button) is referenced in the live GTFS data feed. In this example, BX190093 corresponds with a majority of all the trips. Along other routes, though, distributions have been far more dispersed. If you examine each of these shapes, they are often either nearly identical or represent fractions of the total route. As a result, it becomes overly complicated to simply get a de facto route line for any given bus route since there is no single route to reference.
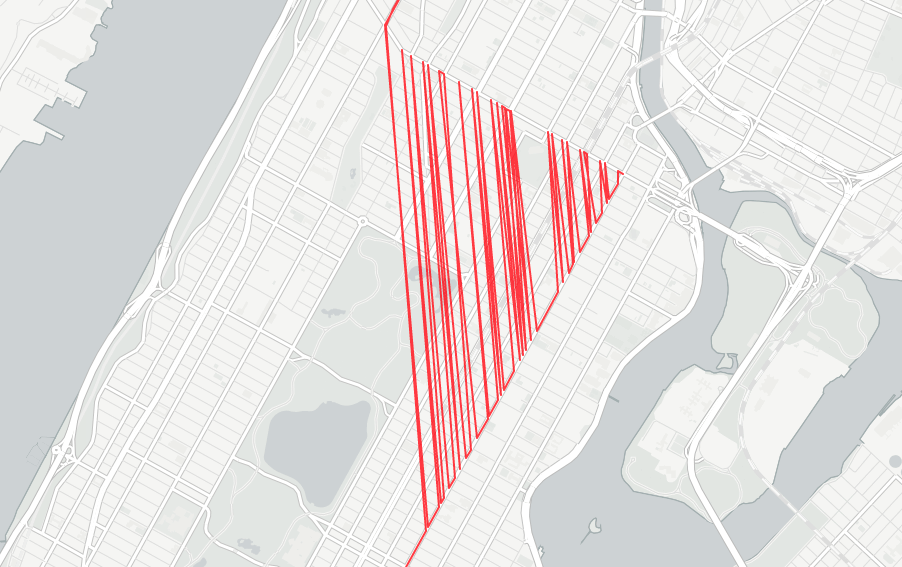
At this point, I could have simply parsed through a either pulled out the most frequently used bus route shape from each route or I could have custom selected a shapefile to define each route myself. But, instead, I thought this was an opportunity to create a simple tool that could combine all the given routes and extract a one “final” route that is a combination of all the variations that are included. Because of the way that trips are published from other sources, both in public transit and otherwise, such a tool might prove useful in other cases, as well (or so I hope). In the following example, I will take a sample of 10,000 GPS trace points from preserved MTA GTFS live feed data for the M101 line in Manhattan and try to infer the bus route without using any information from the specific points other than the latitude and the longitude.
In the above image, you can see what the base unsorted data looks like if plotted as a GeoJSON lineString in Leaflet. As you can see, two things are happening here. First, the northbound and southbound trips are being confused into a single line (there are roughly two parallel routes that can be inferred from that image). Secondly, there are multiple paths being overlayed on top of one another and thus the combined array that is the result of these multiple breadcrumbed trips is, in effect, disordered. Thus two things need to happen immediately. First, I created an object sfToolkit that includes class shapefiler and a series of utilities functions. The first utilities function I created was splitDirections which takes in the raw_data and looks for the given object key direction_id that corresponds with inbound and outbound trips. It returns two arrays, a 0 and a 1, for whether the trip is inbound or outbound. This has been built as a utility as it is outside of the bounds of the basic latitude/longitude-only approach I have taken for the rest of my content. Upon receiving this cleaned/sorted directional data, all the end user ought to need to do is create a new sfToolkit.shapefiler instance and ask for the cleaned data (given specific option parameters), as in the following code example.
var parts = sfToolkit.splitDirections(path, 'direction_id'),
    options = {
      shuffle: true,
    };

var sf = new sfToolkit.shapefiler(parts[0], options);
return sf.getCleaned();
If you’re uninterested in the mechanics of how we arrive at the cleaned array, this is a great place to stop. If you are curious as to how I arrived at the mechanics present in the tool, then please read ahead! Also, please note that this is definitely a work in progress and I will be actively updating this project in the days and weeks ahead. I also am well aware that I may have failed to account for certain route conditions and there are cases where this current tool might fail to produce useful results. If you have any thoughts on how to improve the tool, please do not hesitate to either contact me (in the section of my site that has the contact submission tool) or participate with me on the project on Github.
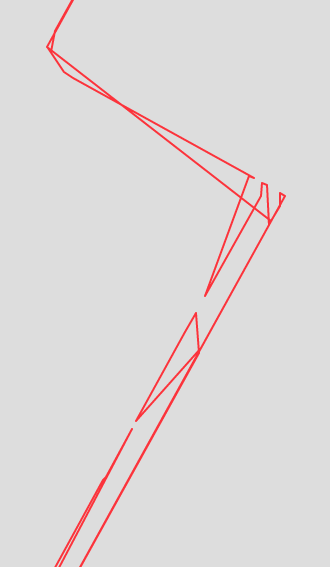
Why not just iterate through this list and find the point closest to the prior closest point? Doing so, without any sort of control, will result in sort of “crazy” results. In the above pictured example, the algorthm happened to grab a point in the middle of the route and “grew” the path from there. As you can see, a sort of bizarre zig sag resulted, as the algorthm sought a following closest shape. My first thought to resolve this was to simply find the farthest point and then, from there, simply run a nested for loop through the remaining array values and keep appending the point that ends up being closest to the prior point. Not only is this method slow, it is unintelligent. I’ve preserved it in the class for those interested in comparing the results of that method versus the employed one.

Not only is the method slow because it loops doubly on itself, it also fails to account for order (whether the closest point to the point being evaluated comes before or after the point being evaluated). Failing to account for order was particularly noticeable when handling corners. In the above .gif, lines are drawn following each points addition, drawn from the point prior. As you can see, corners failed to sort correctly. The result of such disrder would be the appearance of “zig zags” on the corners, where points would be in disarray. In order to handle the issue of failing to account for the order where the closest point might lie, a simple checker was introduced. I include it below to provide contrast for the increased complexity of such a measure in the later iteration of this sorting mechanism.
var prior = order[order.length - 2];
if (prior !== undefined) {

  // B = before, E = each, L = last

  var distBE = calcDist(each.lat, each.lng, prior.lat, prior.lng),
      distEL = calcDist(each.lat, each.lng, last.lat, last.lng),
      distBL = calcDist(prior.lat, prior.lng, last.lat, last.lng),

      dist_bef = distBE + distEL,
      dist_aft = distBL + distEL;
  if (dist_bef < dist_aft) {
    placeAfter.before = true;
  } else {
    placeAfter.before = false;
  }
} else {
  placeAfter.before = false;
}
As should hopefully be explicit, this simply creates a checker to when a new closest point is found and determines if there is the possibility that the point is better suited to be before the last most point currently in the ordered list. It does this by summing the distances between the second to last and last point, as well as the point currently being evaluated when in both order sets. It then uses the variant with the shorter overall distance to dictate whether the resulting/final placement should be before or after the last most point in the current ordered list.
What was most concerning, ultimately, with this dumbReorder method is the speed with which this method completed the task. Parsing roughly half of the ~5,000 data points (half of the 10,000 MTA data points and thus account for one single direction on the route) at a sensitivity of 5 meters (dropping all points that lay within 5 meters of a prior point) takes 26,892 milliseconds, or roughly 27 seconds. This is unacceptably long. The following method attempts to both improve upon the dumbReorder method’s weakness for handling edge cases particularly around corners while speeding up the process of generating a result. As of publication, the following method has managed to achieve substantial reductions in both speed (time it takes to calculate the results), and accuracy. Currently, the turnaround is pegged at 4,411 milliseconds, or roughly 83.5% reduction in performance time.

One primary issue with the first method was the double nested for loop. Whatever the base input array length was, a for loop iterating for index count equal to that base data length would be iterated through and, for each indices, the entirety of the base array would be looped through again to check each point against all other points in the base array. The new reorder function seeks to mitigate this issue by creating a new, empty “final” array. Elements are taken from the base array and placed into the new array. Each time an items is removed from the base array, it is placed at each possible point in the new array. The point where it lies closest becomes the seelcted indices. This method is visualized through the above .gif, where the closest potential point is shown, indexed between the points of best fit, with the prior and subsequuent points highlighted for clarity.
Just as in initial reorder method, we crawl through the final array and find a point where the target point lies closer than any of its predeccesors. But, this time, I try and handle every possible condition it could be. For example, if the current indices is of value 0, then I simply need to perform a similar distance comparison to the one shown in the example for the first version of this method where I just see if it makes more sense for the point to be before or after that 0 point. I handle the case where the incex is equal to the new order array length minus one in the same manner as well. Finally, if the point happens to lie within the array and not at either extremity, then I perform a comparison of two triangles, where I calculate the distances between the target point and the points before and after it, given the placement of the new array value given its placement on either side of that “middle” value. A .gif shows what this looks like, in action, above.

Looking ahead, I want to introduce a secondary sensitivity analysis. In the above example, a visualization demonstrates how one misplaced point can send the whole array result into disarray. To deal with this, I built a utility to pair with calcDist called calcAngle that is calculates the angle of a point, given three distances using the SSS method from geometry all those years ago. Using SSS, I can find the angle of a given point and, with that, use “tight” angles to trigger a method that can deal “sanity check” the point’s placement. For example, In the above example, placing that point introduced a number of sub-50 degree angles in the route. My thought is to have such angle trigger an alarm that kicks in a recursive method that checks against all other options for such a points placement and, if, within a certain level of sensitivity perhaps placed as on option from the user, the point also fits at a second point, moves the point to that location and restards the check process to see if that point is appropriate. A base case would either be all potential points being exhausted or the location being a point that does not cause a “zig zag” and retrigger the checker mechanism. A further strategy might be to crawl back and forward on the route and see if those points are straight. If those points are straight then the point’s angle might be excused. Situations such as freeway offramps will surely be sticking points and, for my next task, I seek to deal with those directly and handle edge cases associated with those in the shapefile toolkit.