I wanted to explore the CitySDK Census Module Query interface. When this first came out roughly a year ago I thought it had potential but had not yet been built out. Since then, it appears some solid strides have been made. The post powerful aspect, conceptually, of this tool is that a single API interface and structure can become interoperable between any comparable urban/civic structure in the country. For example, the same tool built for Las Vegas might work “instantaneously” for Detroit.
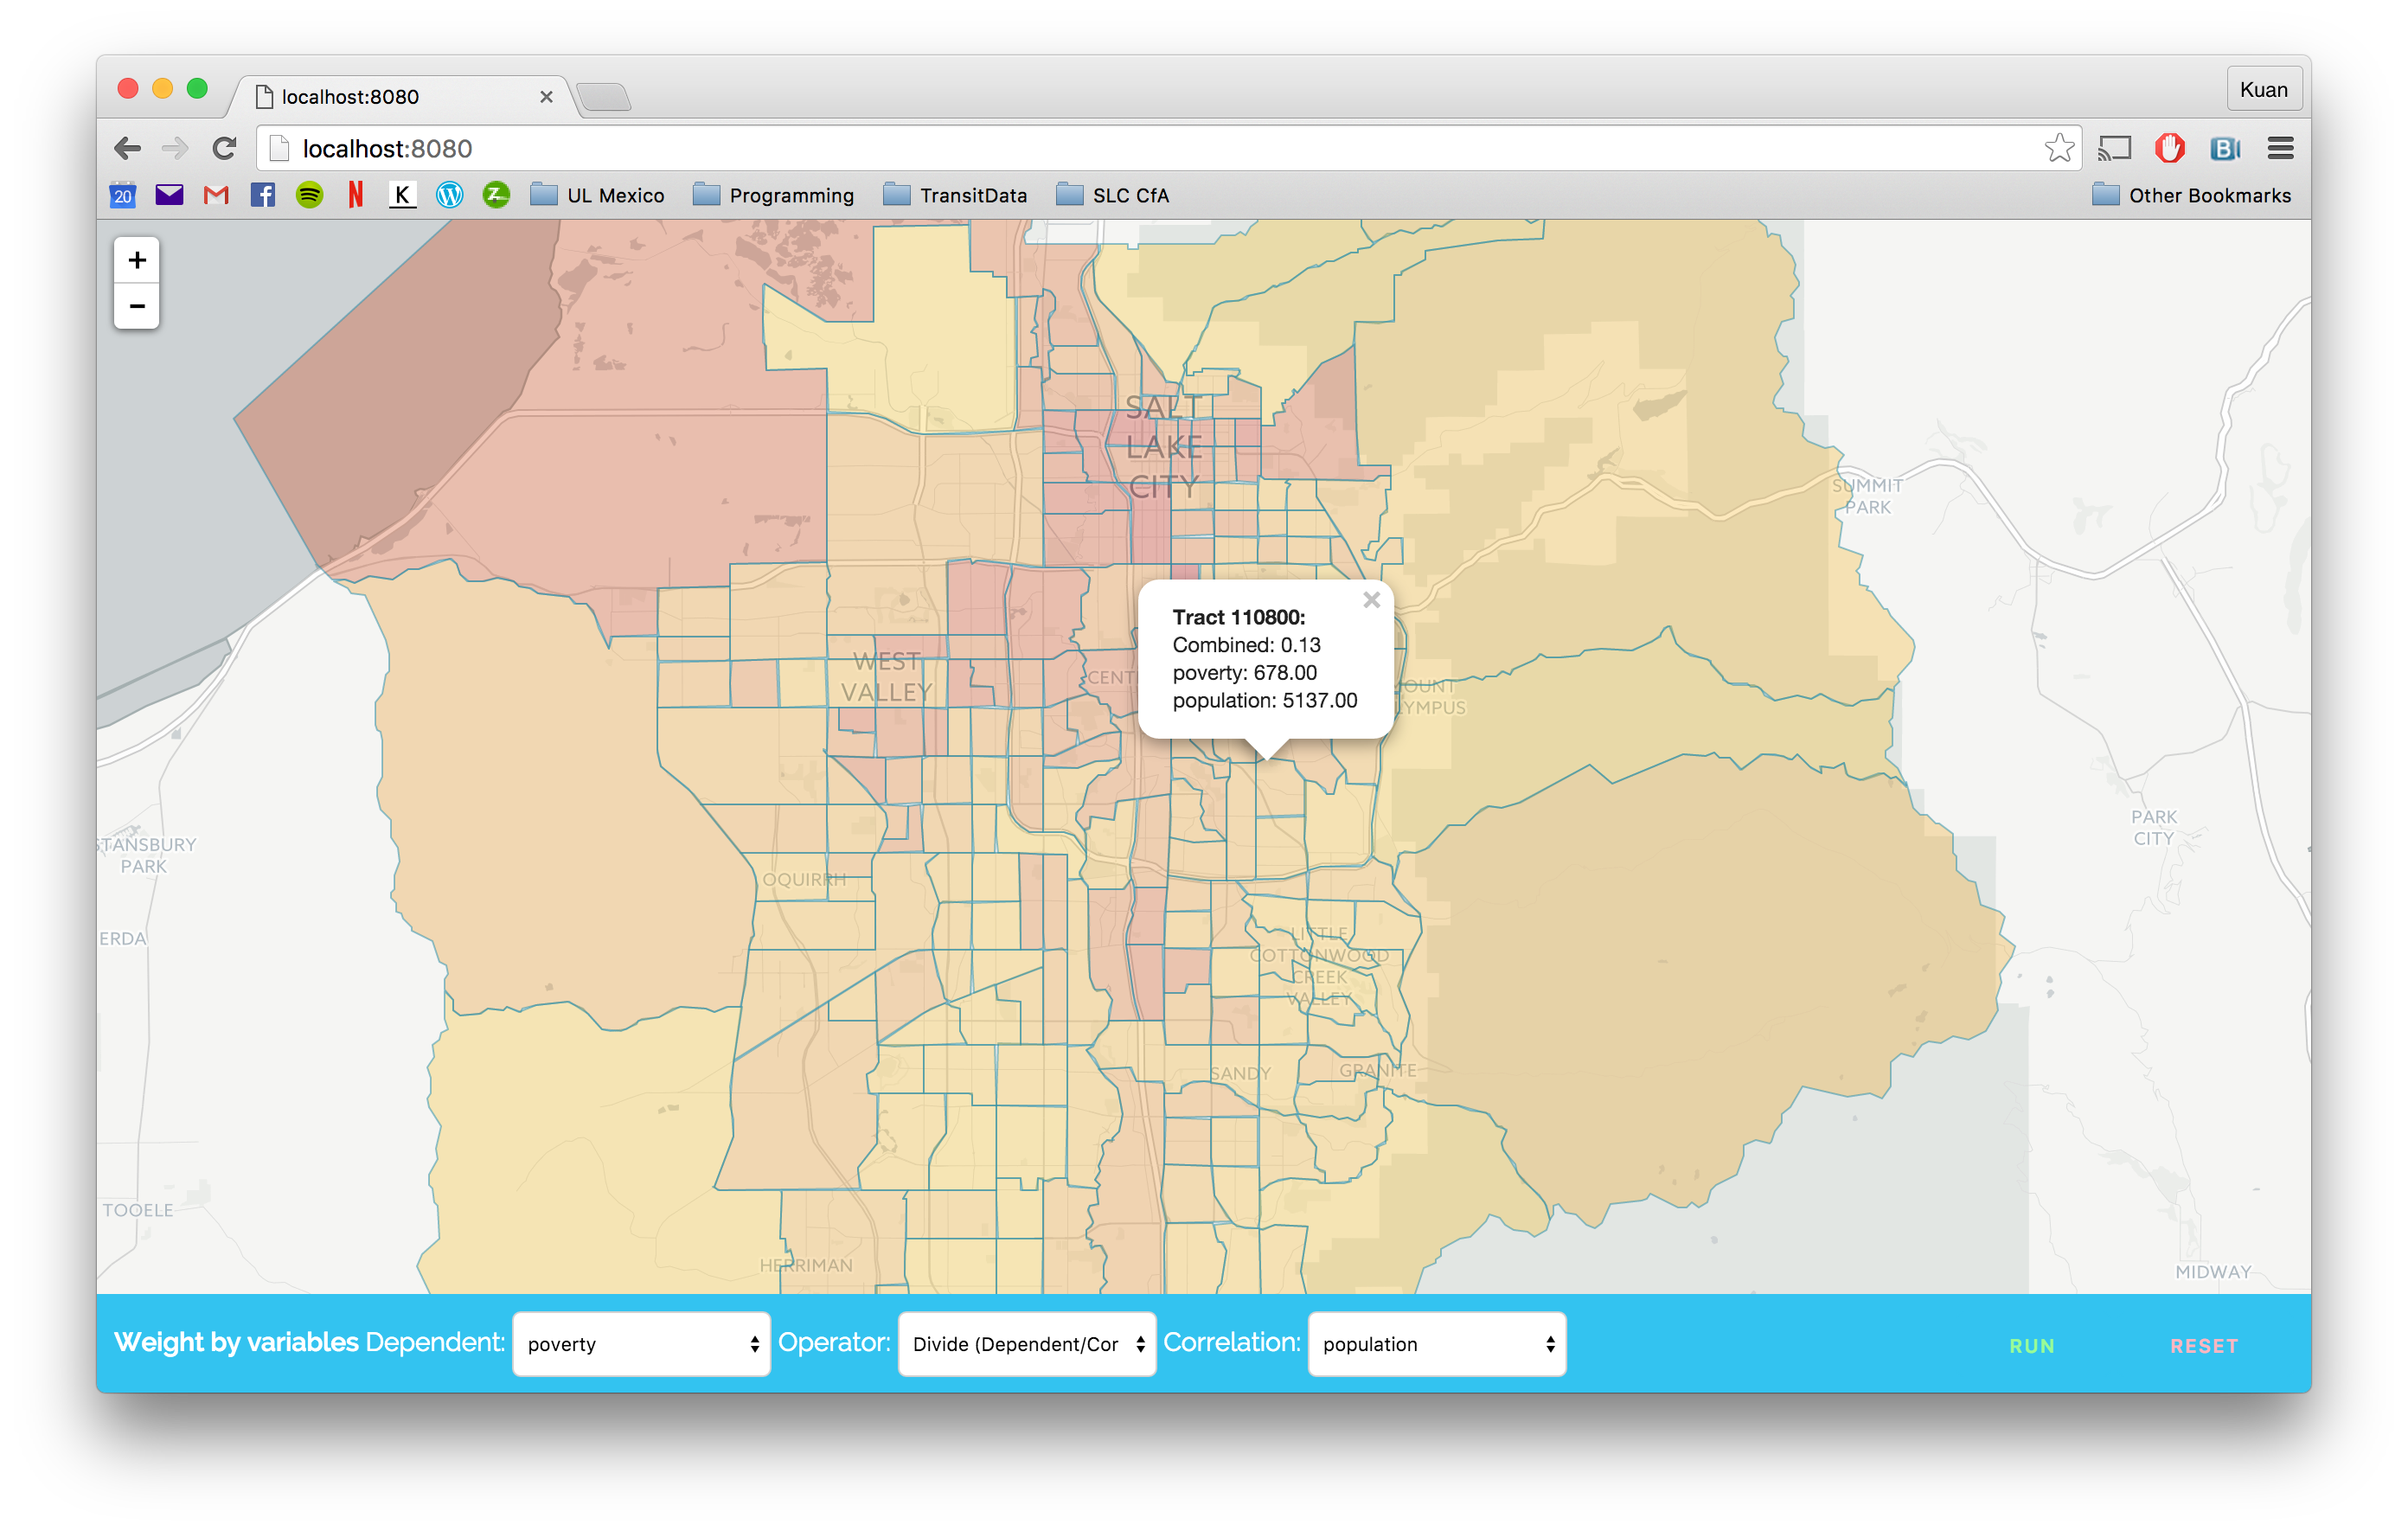
To explore this tool and allow non-technical users to explore the potential of the tool as well, I decided to throw together a simple GH-Page site that allows users to explore the roughly 123 variables that are provided through the tool. Also, one common process that folks perform in GIS, for example, is to observe the relationship between 2 variables. I wrote a simple function that allows users to explore the relationship between any 2 variables by either multiplying, adding, dividing (most common, probably, for ratios), or take something to the nth variable of another. Again, this is just a preliminary tooling around with the API. Addendum: Additional features have been added, including auto-integration of Socrata data, as well as heatmap generation. Scroll to the bottom paragraph to read about those additions.
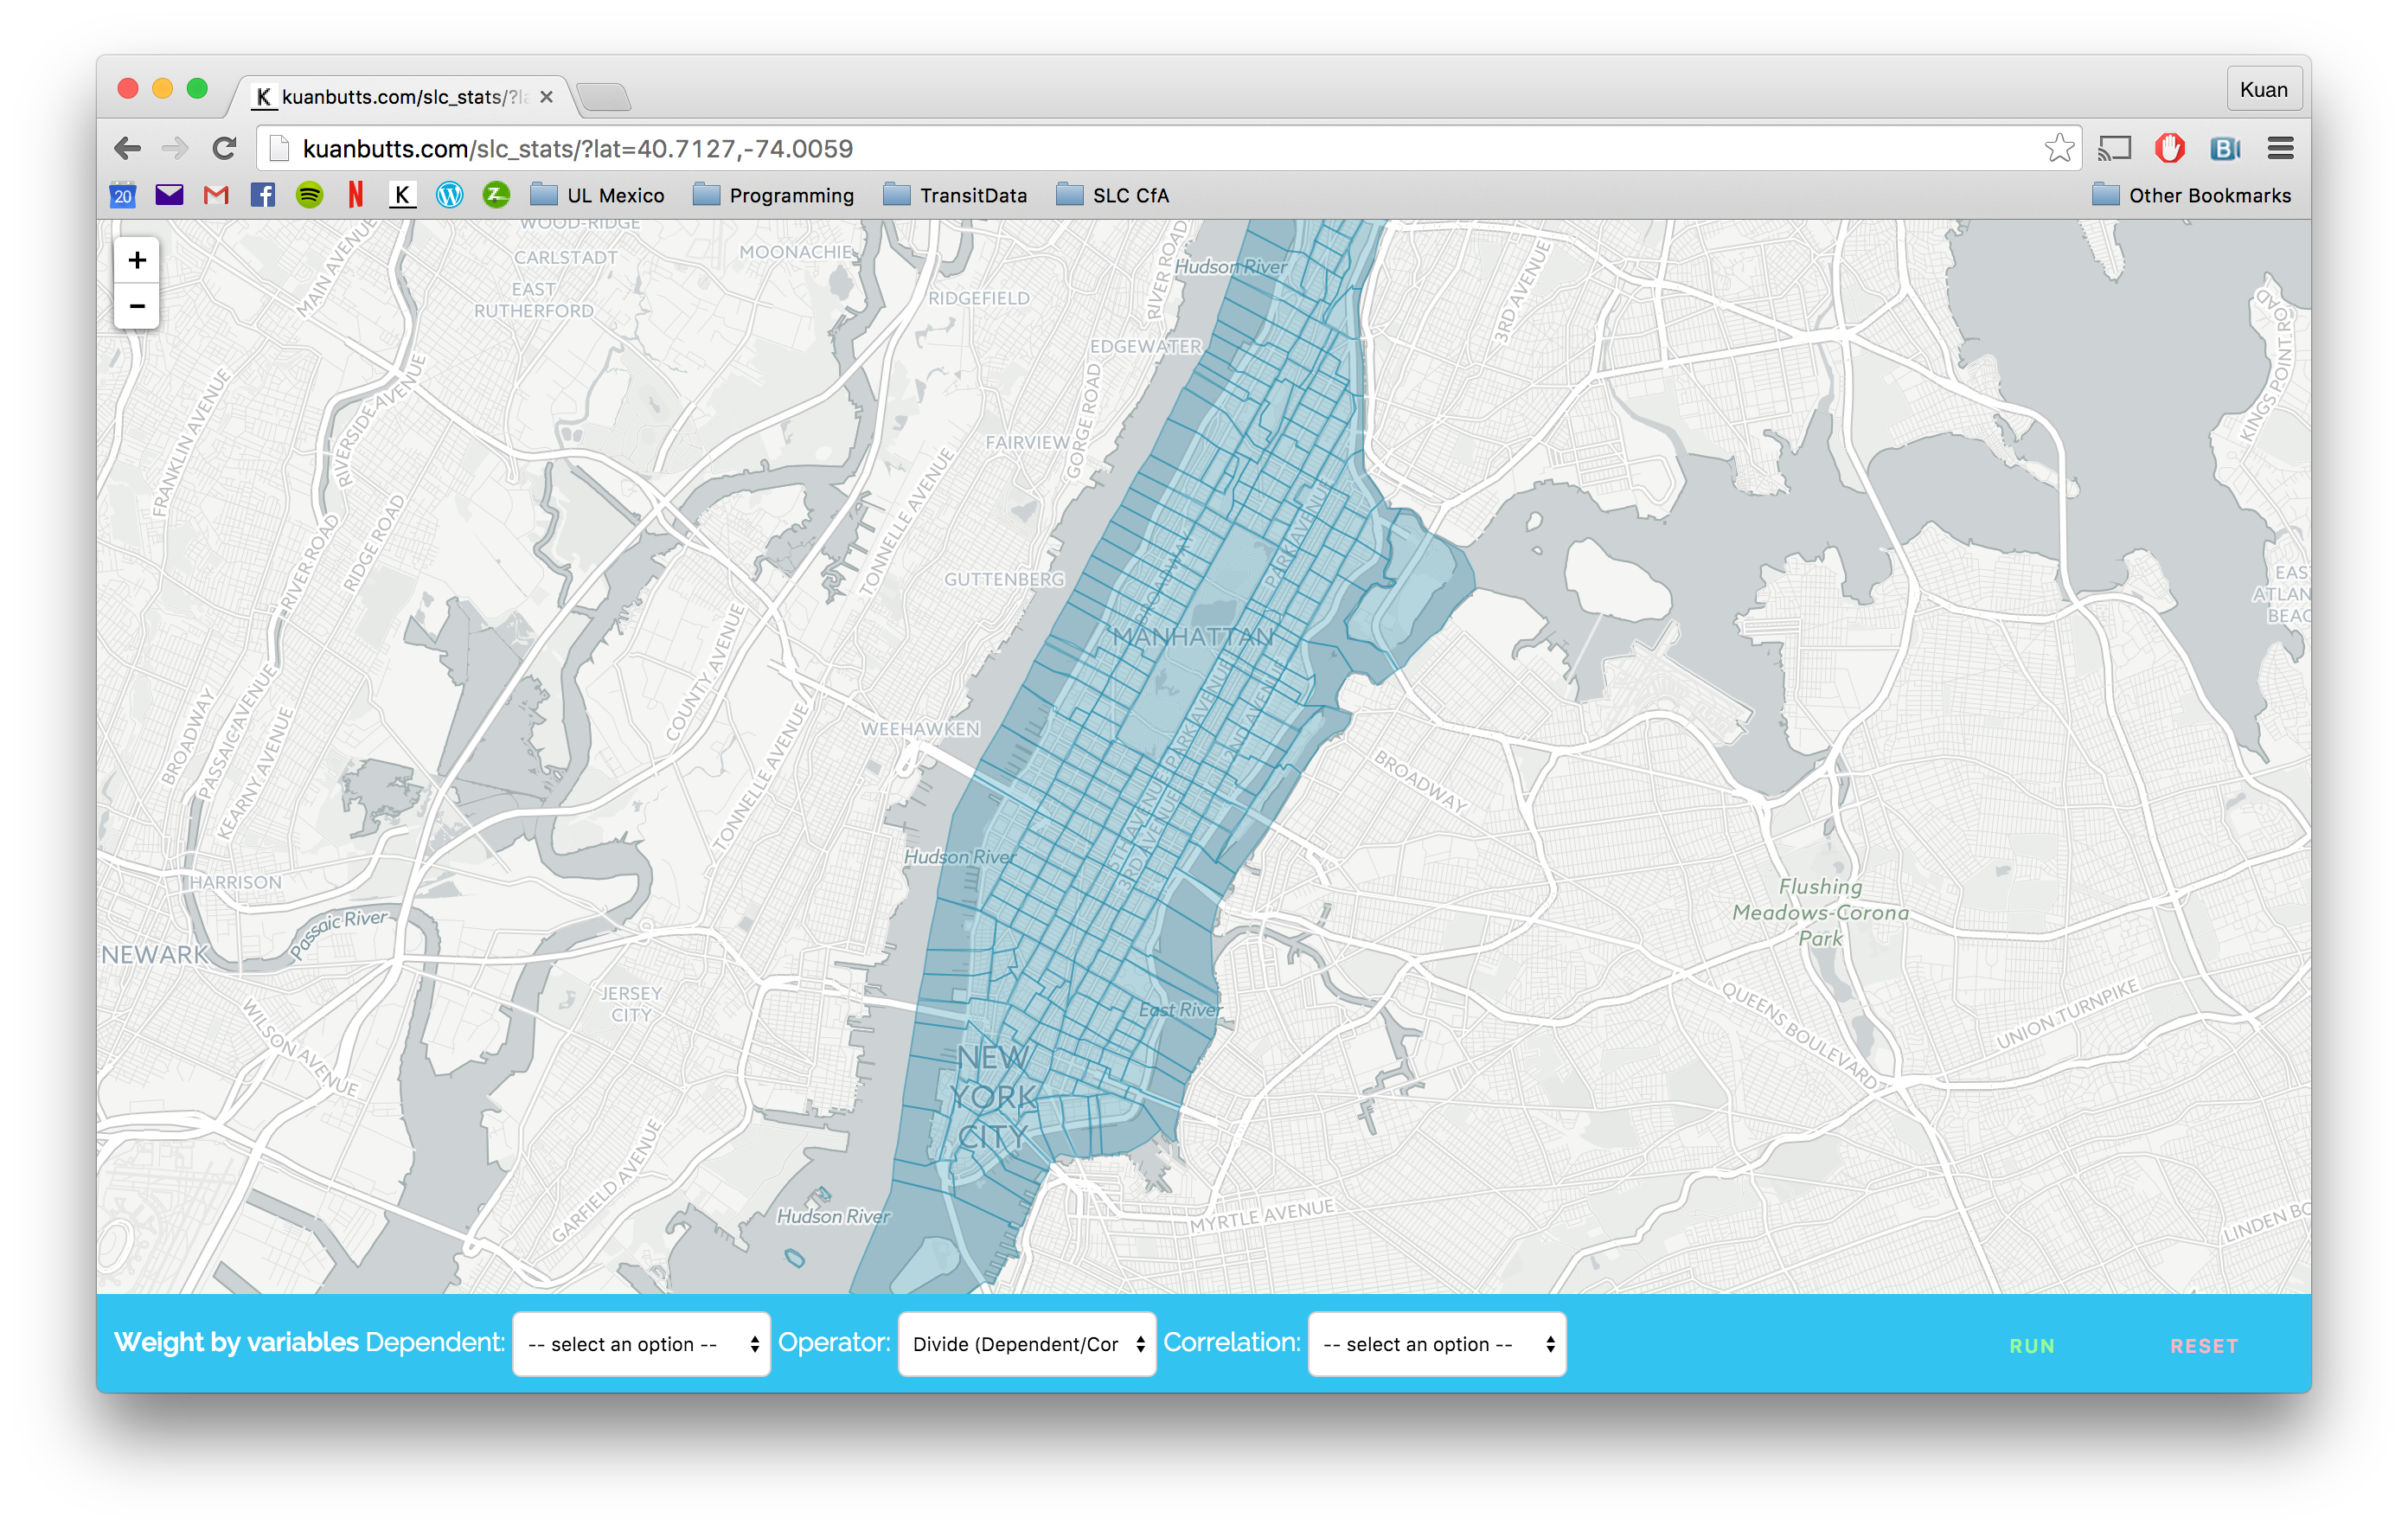
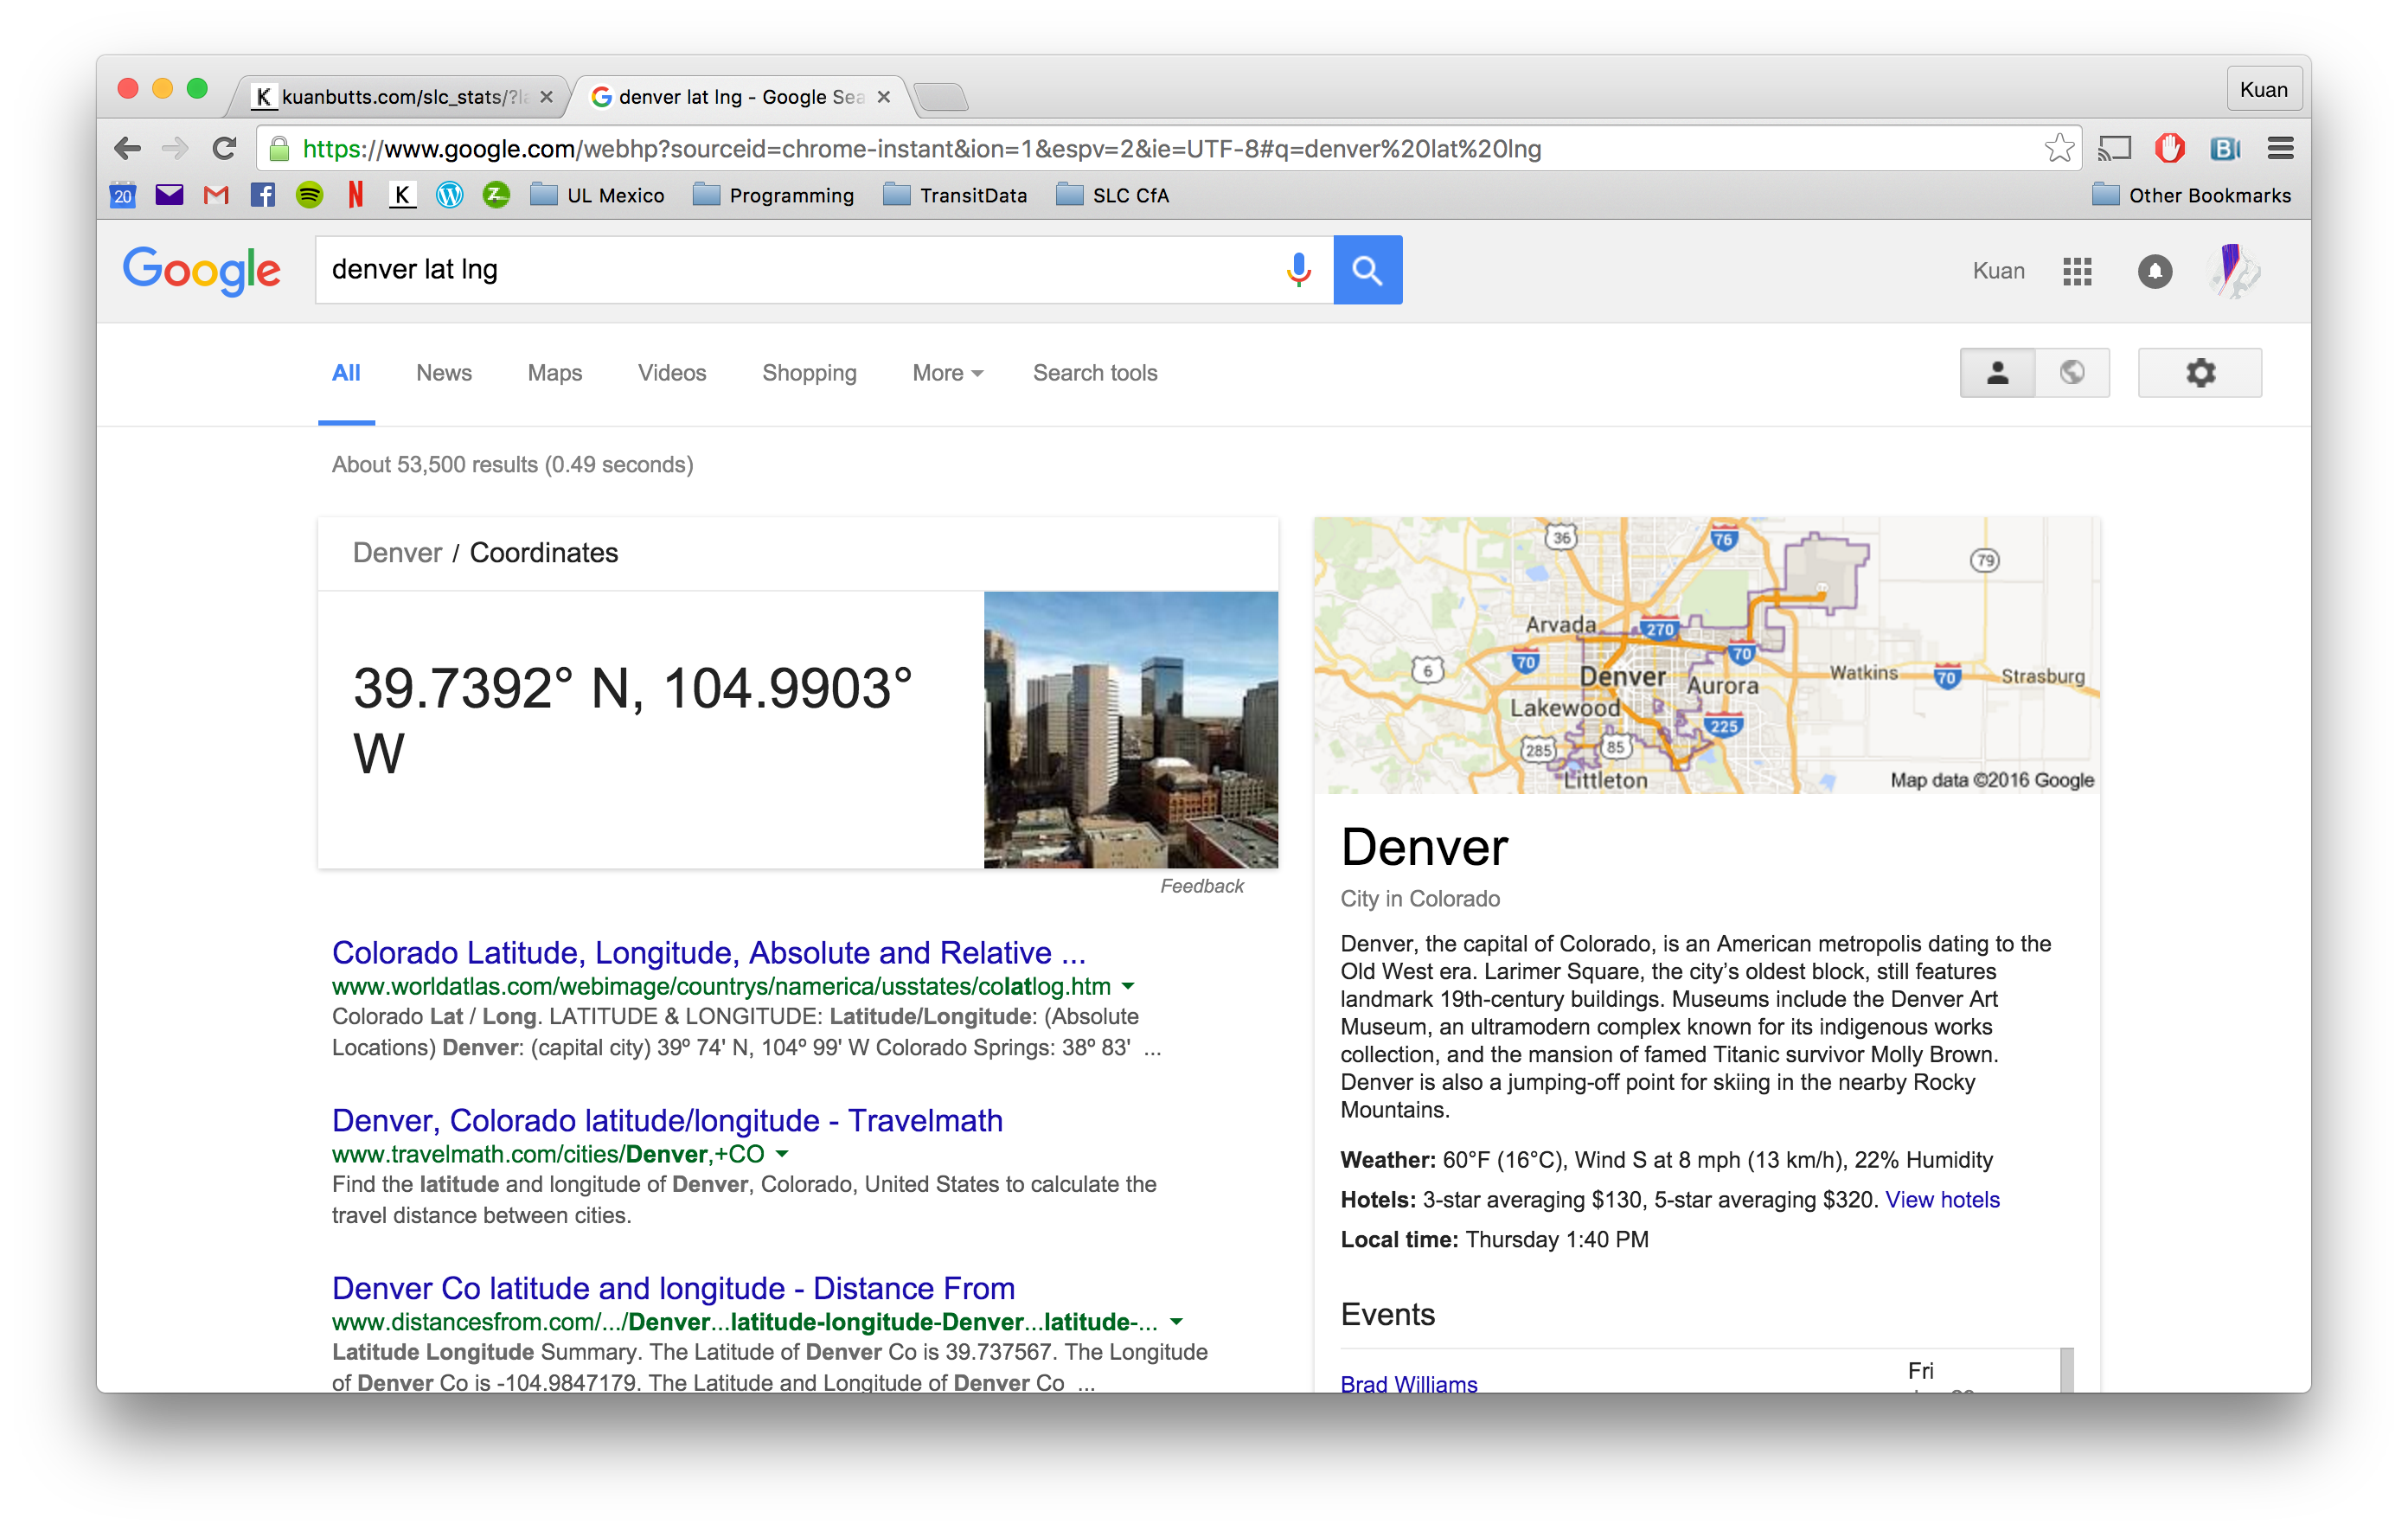
Since the API allows this tool to become “automatically” interoperable in any city in the country, you can quickly readjust to where the tool queries for by simply submitting a different latitude/longitude in the URL. For example, in the above image, if you look at the URL, I have just included the lat/lng pairing for New York City. If you are having trouble figuring out what your city lat/lng is, just type in the name of the city into Google and add the phrase “lat lng” to the end of the search query. See the screen captured example below.
In the above example, the URL parameters is created by entering /lat=12.34,-23.45. I don’t know why I chose lat as the parameter name. Using loc, for example makes more sense. For continuity’s sake, I am going to support. So, to reiterate, indicating the parameters by either /lat=12.34,-23.45, for example, or /loc=12.34,-23.45, for example, is totally fine.
Also make sure that your longitudinal value is negative when you enter it into the URL. Since longitude is stated as “W” for “West”, it is “negative” of the Prime Meridian. I should note that I absolutely do not guarantee this will work completely for other cities, but it does appear to from the little I have explored. Because Salt Lack County is a, well, county, there is a possibility that the queries I have built may not be completely transferable. That said, I have made an effort to make it “ubiquitous.” If there are observed break points, please list them in the project issues page on the tool’s repository.
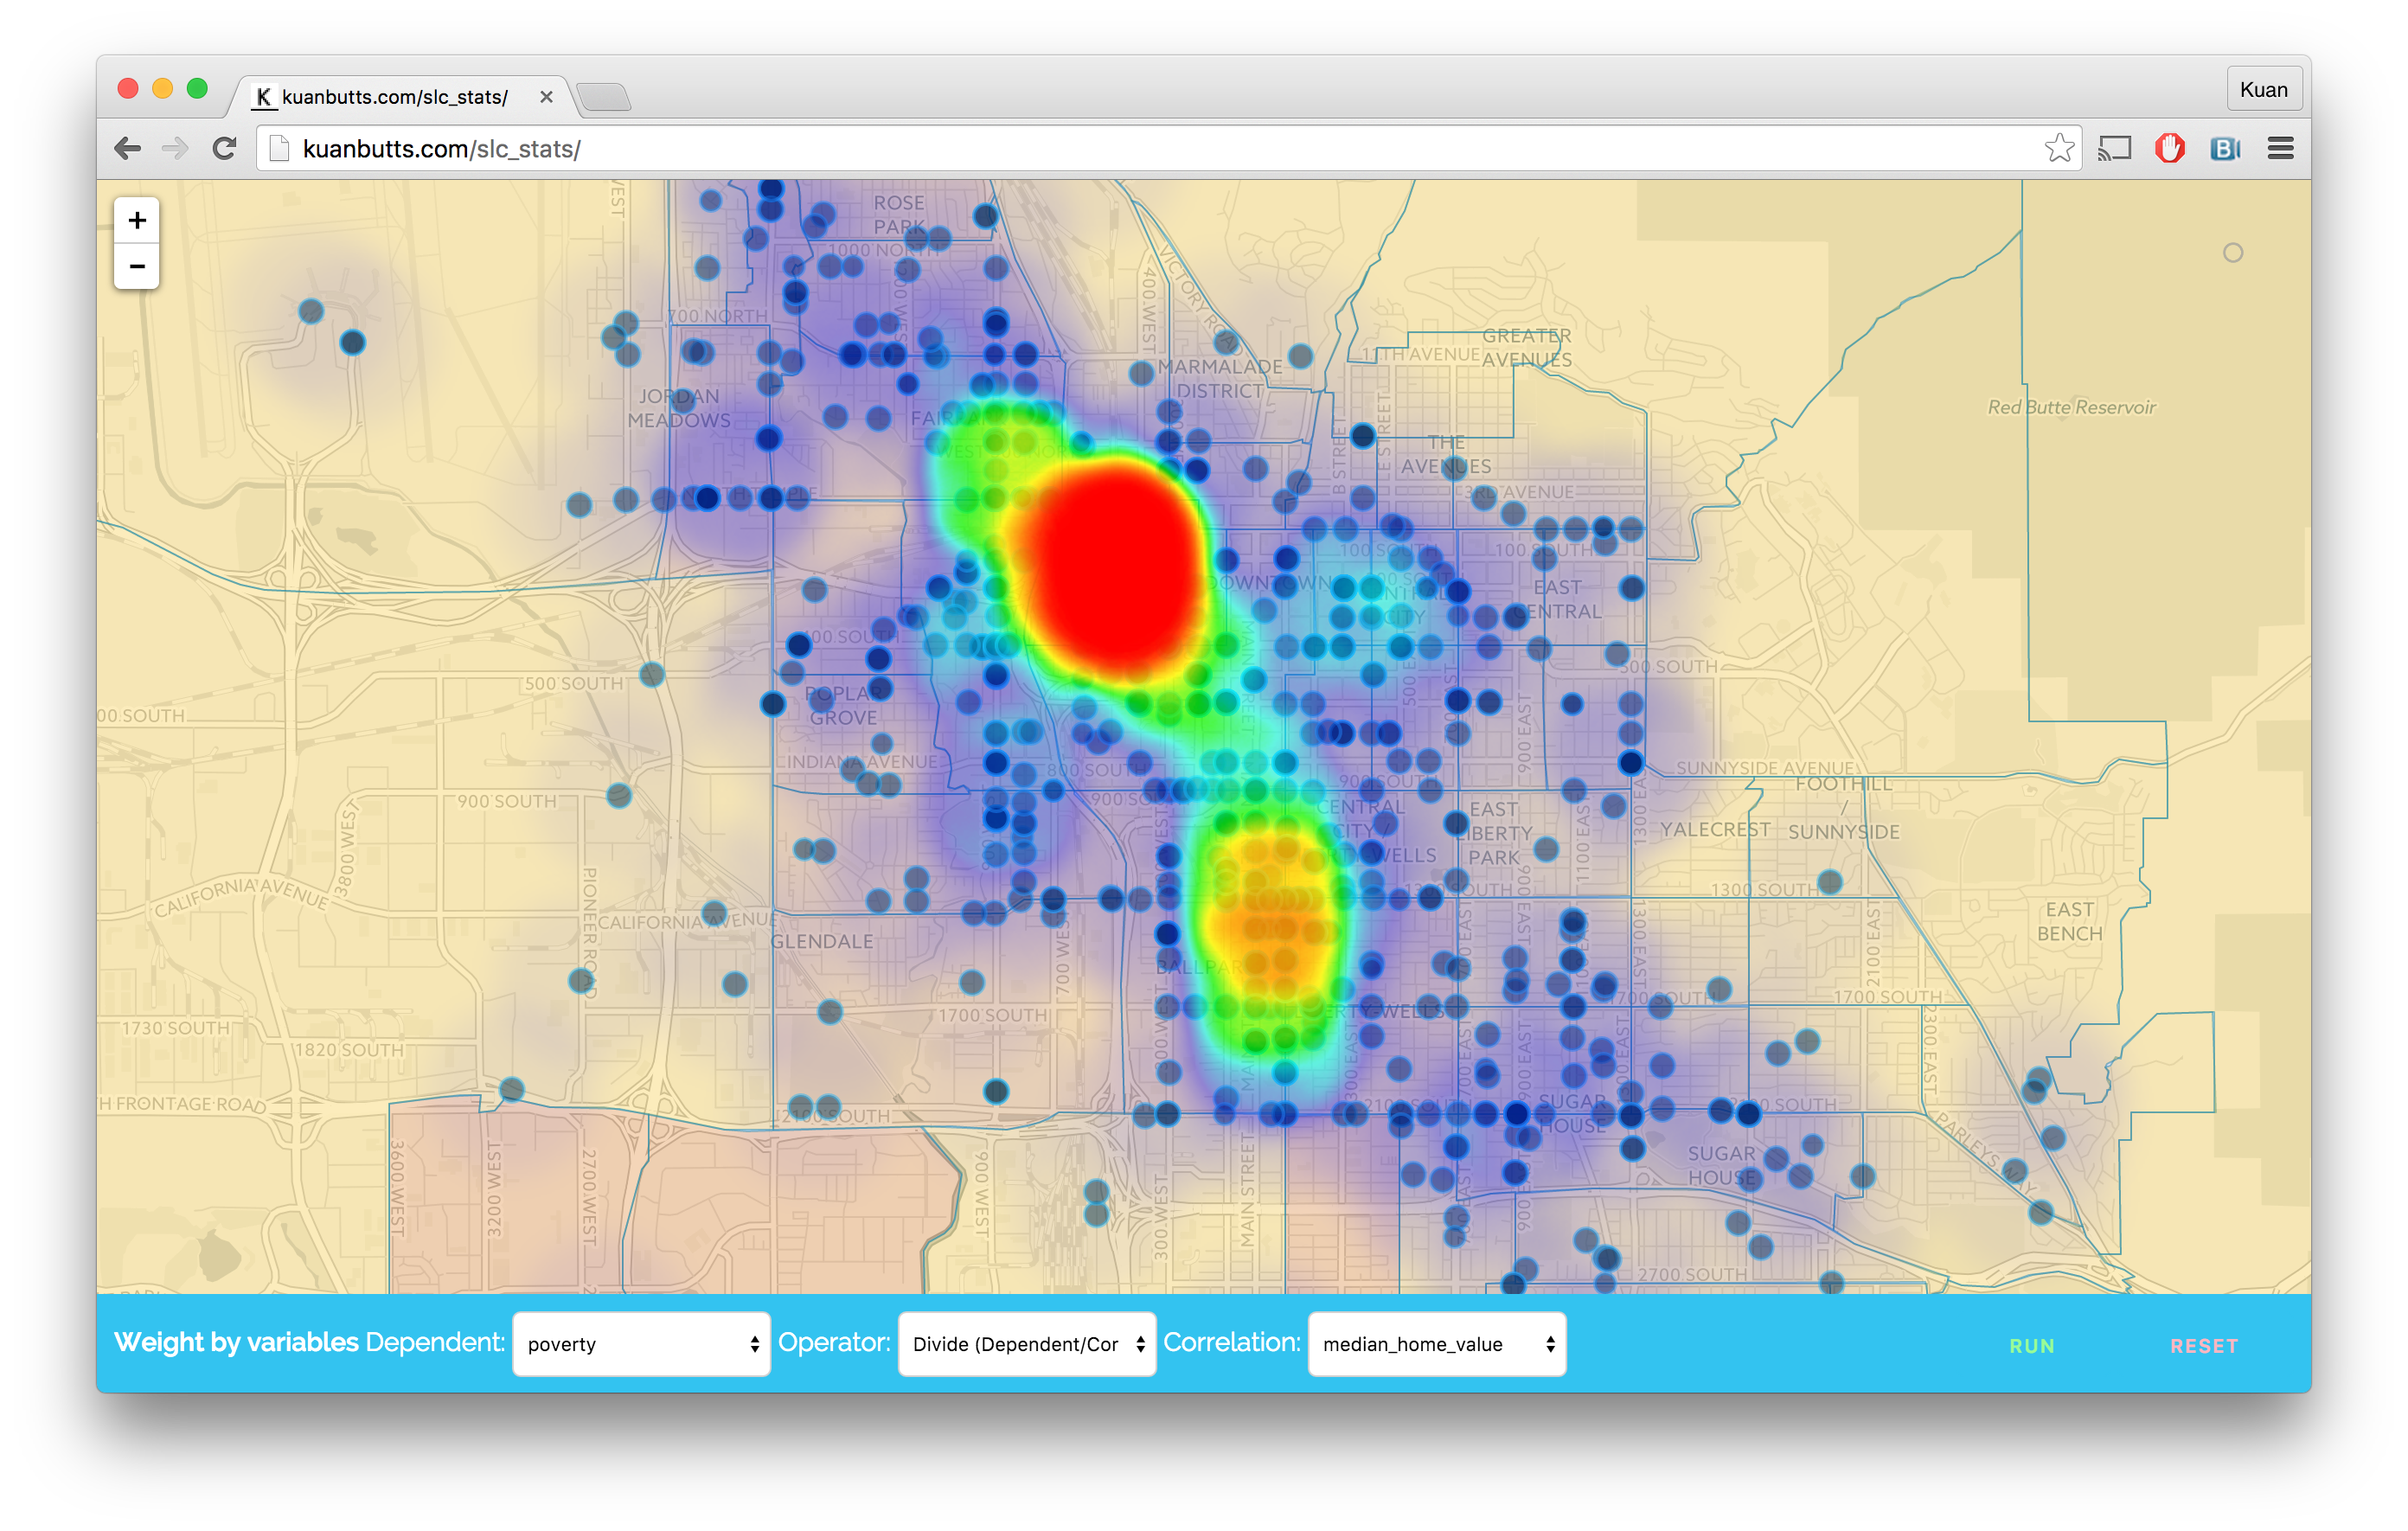
Addendum: I have since added heatmap integration into the service, as well as automatic Socrata data plotting. You can see both in action in the above image. Here, crimes have been plotted from this limited data set that is available on Utah.gov’s open data portal (a Socrata platform offering). Using Socrata’s SODA API, I allow the user to submit a SODA API endpoint from that specific data “Export” options in the portal page. From this URL, I extract the JSON and convert it to a formatted pop up that is associated with each crime data point (or whatever other data point you choose). The heatmap option is just another way of visualizing that data and intensity is calculated via proximity.
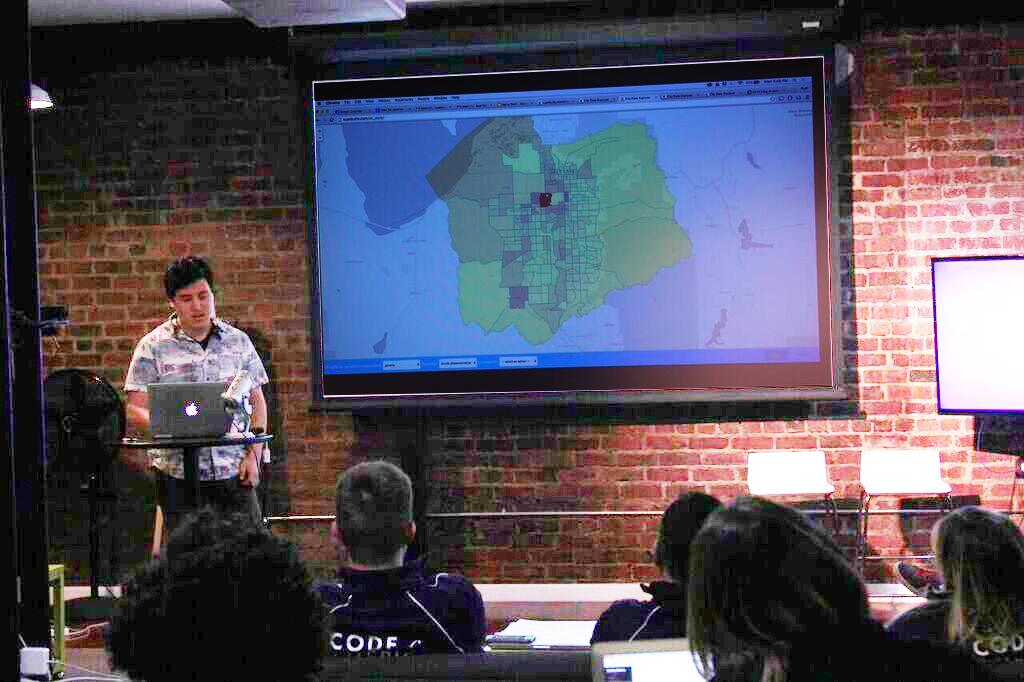
Shown above is an image of me presenting the interface during “Alpha” at Code for America on Wednesday, February 3, 2016.