Introduction
The purpose of this post is to highlight the value of vector tiles in delivering larger, complex geometries to a frontend client for visualization. Rather than simply converting the shapes file of a GTFS to a GeoJSON and serving that file, the data can be compressed and optimized for delivery using tippecanoe, which will convert GeoJSON to a vector tiles.
Streaming of geodata on read and write
In addition, I’ll use new line delimited JSON which allows me to stream each feature geometry in a feature collection on a shape by shape basis to the output GeoJSON file. This reduces memory overhead (do not have to hold the whole geometry in memory or the whole shapes.txt file) and can allow the data to be applied onto larger, or more geometrically complex datasets.
Overview of algorithm
First, write the initial part of the Feature Collection:
# writing the initial
fname = 'transit_lines.geojson'
fc_start = '{"type": "FeatureCollection", "features": [\n'
with open(fname, 'w') as filehandle:
    filehandle.write(fc_start)
After this, we can assemble each line string representing a route from the GTFS per each new line and add that to the file. Then, we can write the end of the Feature Collection and be done with the write of the file.
Here’s the full code for reading through the GTFS zip file’s shapes.txt file and writing each new geometry as a new line:
import json
import zipfile

def process_bytestr_line(l):
    return l.decode().replace('\r\n', '').split(',')

def generate_feature(coords, shid):
    feat = {
        'type': 'Feature',
        'geometry': {
            'type': 'LineString',
            'coordinates': coords
        },
        'properties': {
            'shape_id': shid,
        } }
    return feat

# identify the location of the zipfile
zfile = zipfile.ZipFile('data/los-angeles-metro-bus.zip')

# iterate through the files contained within
for finfo in zfile.infolist():
    if 'shapes.txt' in finfo.filename:
        # extract the shapes file from the gtfs
        openfile = zfile.open(finfo)
        break

# get the header row of the shapes file
headers = process_bytestr_line(openfile.readline())

# writing the initial
fname = 'transit_lines.geojson'
fc_start = '{"type": "FeatureCollection", "features": [\n'
with open(fname, 'w') as filehandle:
    filehandle.write(fc_start)

curr_shid = None
curr_coords = []
for line in openfile:
    d = {k: v for k, v in zip(headers, process_bytestr_line(line))}

    # initialize
    if curr_shid is None:
        curr_shid = d['shape_id']

    # trigger roll up when done with a shape
    if not curr_shid == d['shape_id']:
        # roll up a feature and write it out
        new_feat = generate_feature(curr_coords, d['shape_id'])
        with open(fname, 'a') as filehandle:
            filehandle.write(f'{json.dumps(new_feat)},\n')

        # set new shid and reset coords list
        curr_shid = d['shape_id']
        curr_coords = []

    # business as usual/continue asssembly
    curr_coords.append([
        float(d['shape_pt_lon']),
        float(d['shape_pt_lat'])])

# clean up; roll up the last set of coords and write
new_feat = generate_feature(curr_coords, d['shape_id'])
with open(fname, 'a') as filehandle:
    filehandle.write(json.dumps(new_feat))

# finally close out the feature collection
fc_end = ']}'
with open(fname, 'a') as filehandle:
    filehandle.write(fc_end)
Using tippecanoe to compress geodata and serve vector tiles
The output of the prior python process is the file transit_lines.geojson. This file, for the LA Metro system, is over 19 MB. Naturally, this is too large to reasonably serve to the client.
With tippecanoe, we can compress and simplify these geometries simply using tippecanoe’s defaults.
Here’s the cli command that can be used to convert the GeoJSON to a vector tile set using two flags to auto-clean the geometries so that they can be served as compressed vector tiles:
tippecanoe -zg -o transit_lines.mbtiles --drop-densest-as-needed --extend-zooms-if-still-dropping transit_lines.geojsonThis operation will output the transit_lines.mbtiles file. We can see that the original file size (19MB) has now been reduced to 344KB. That is a 55x reduction in file size.
We can now view this file in browser, as shown in the below screen shot:
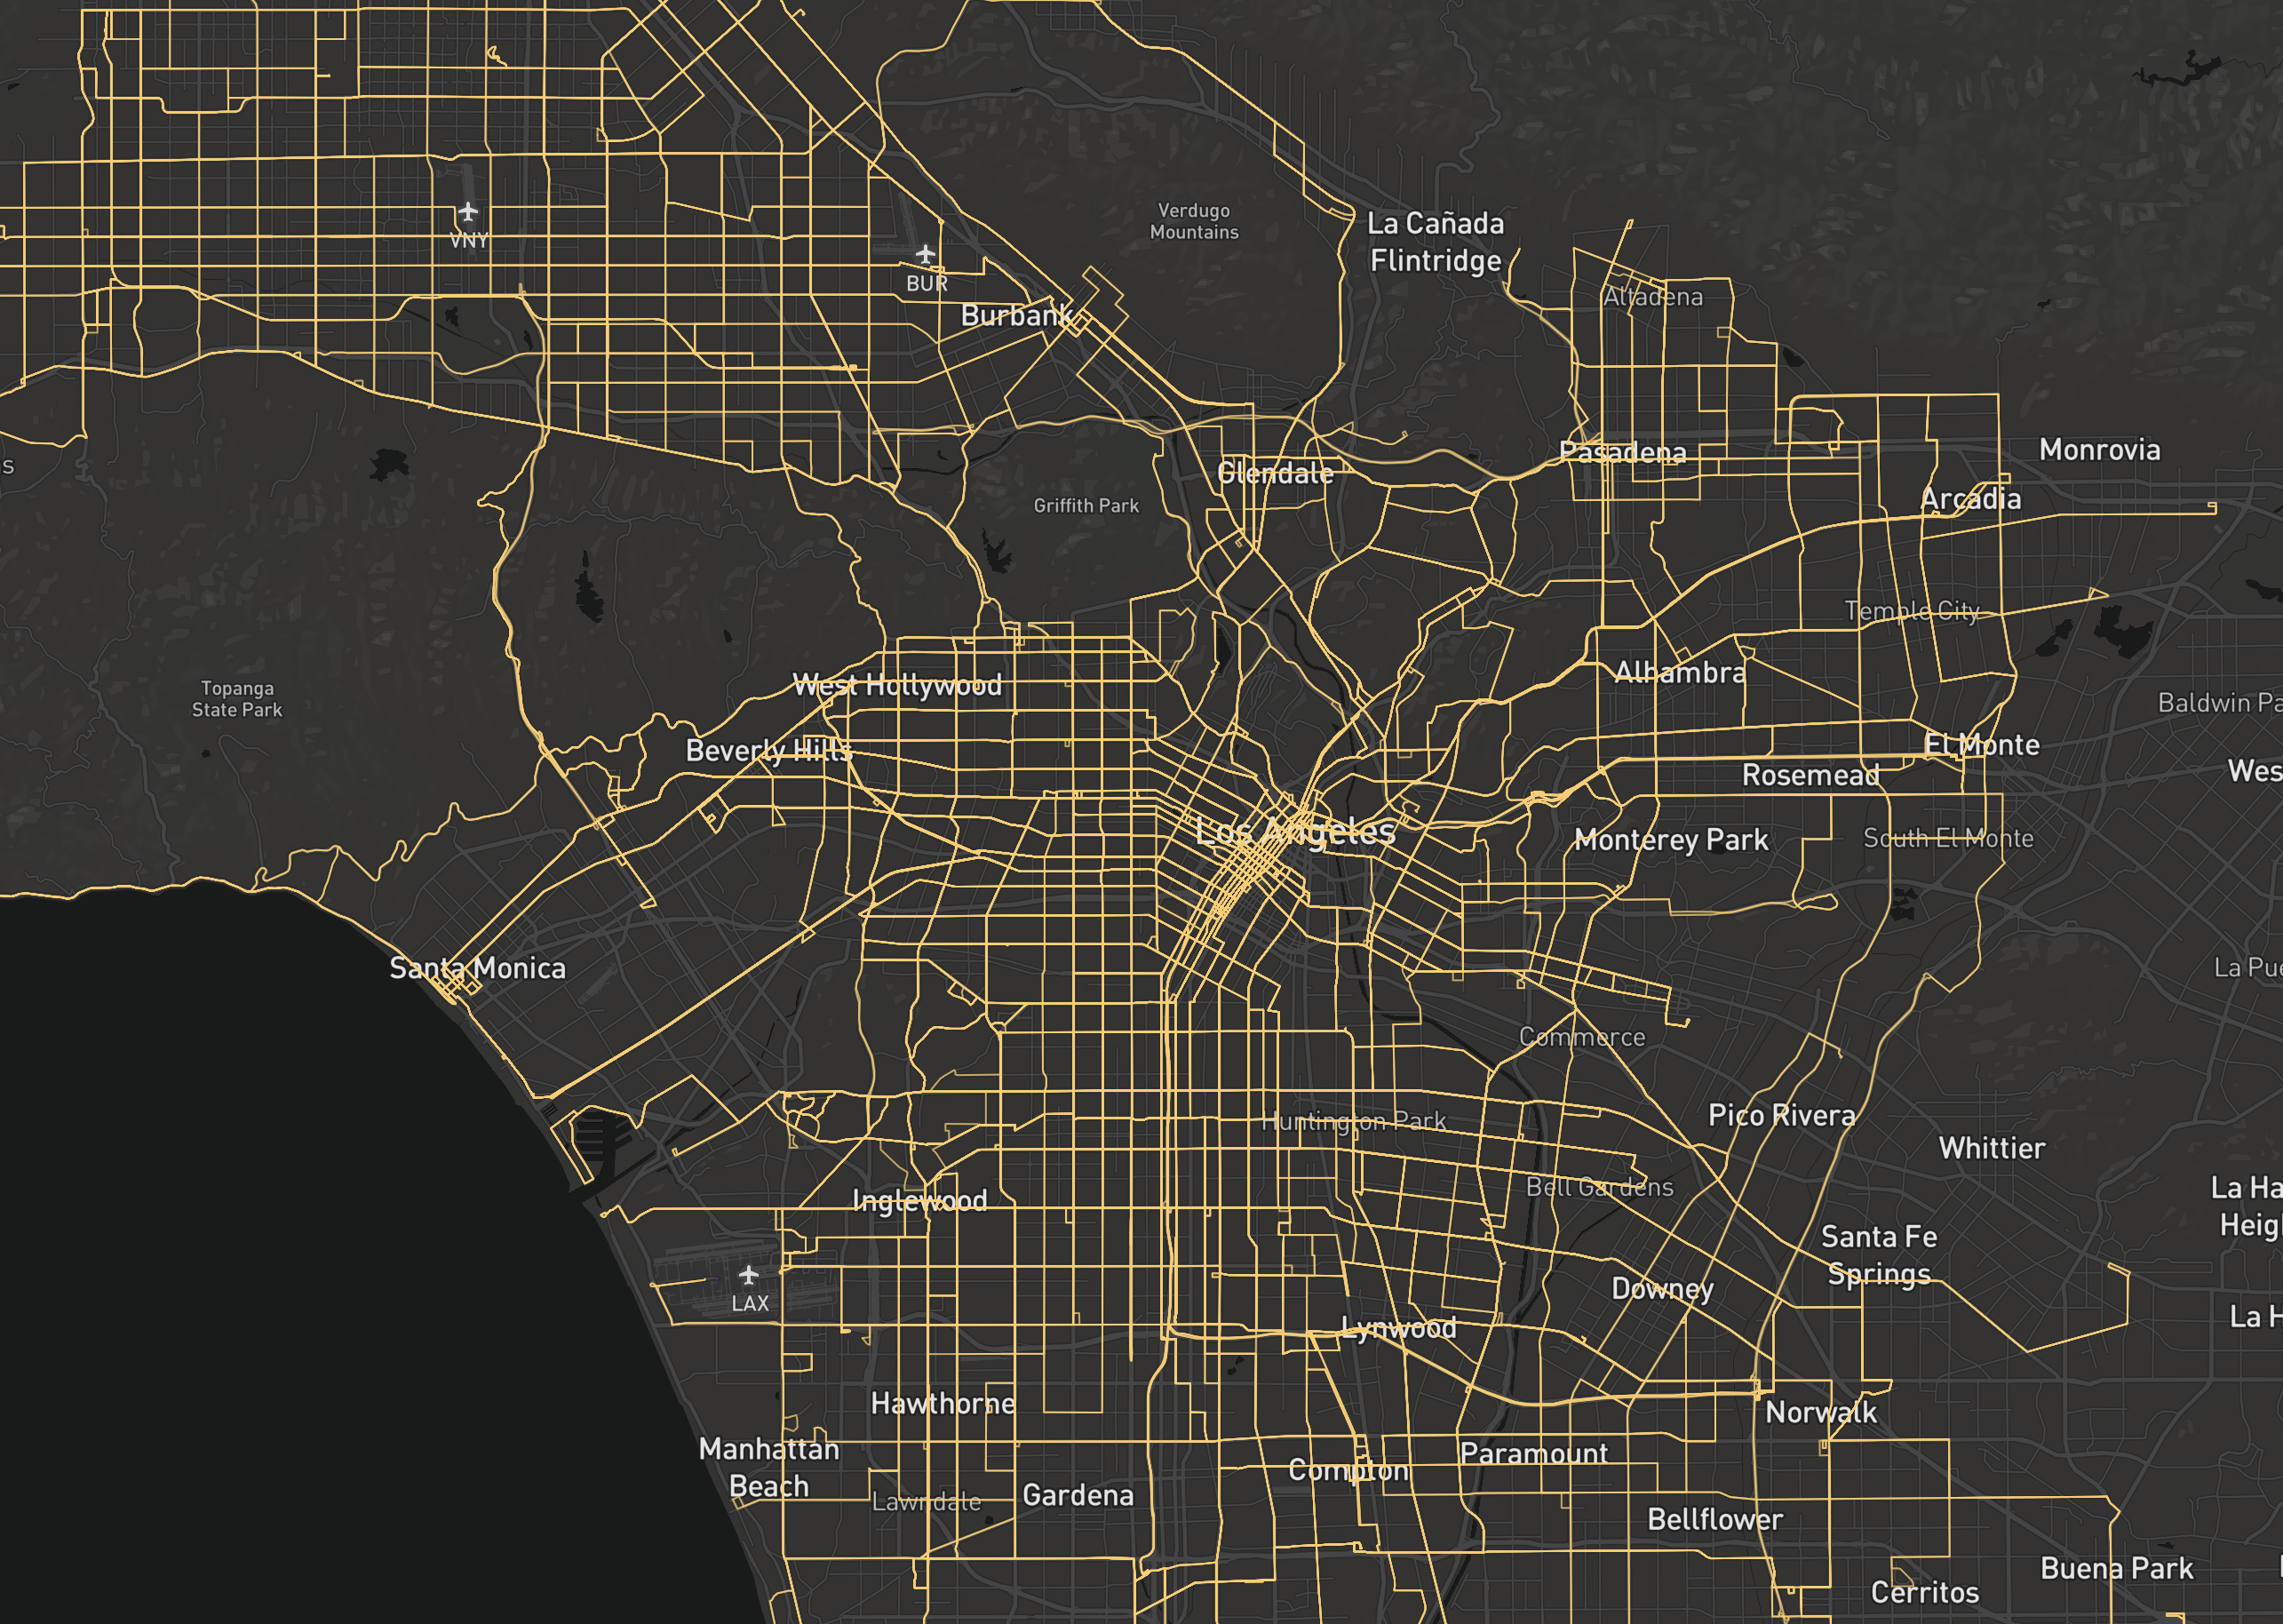
To quickly view the lines, there’s an npm package called mbview (package details here) that will quickly serve the data up locally:
mbview --port 9000 ./transit_lines.mbtilesNext steps
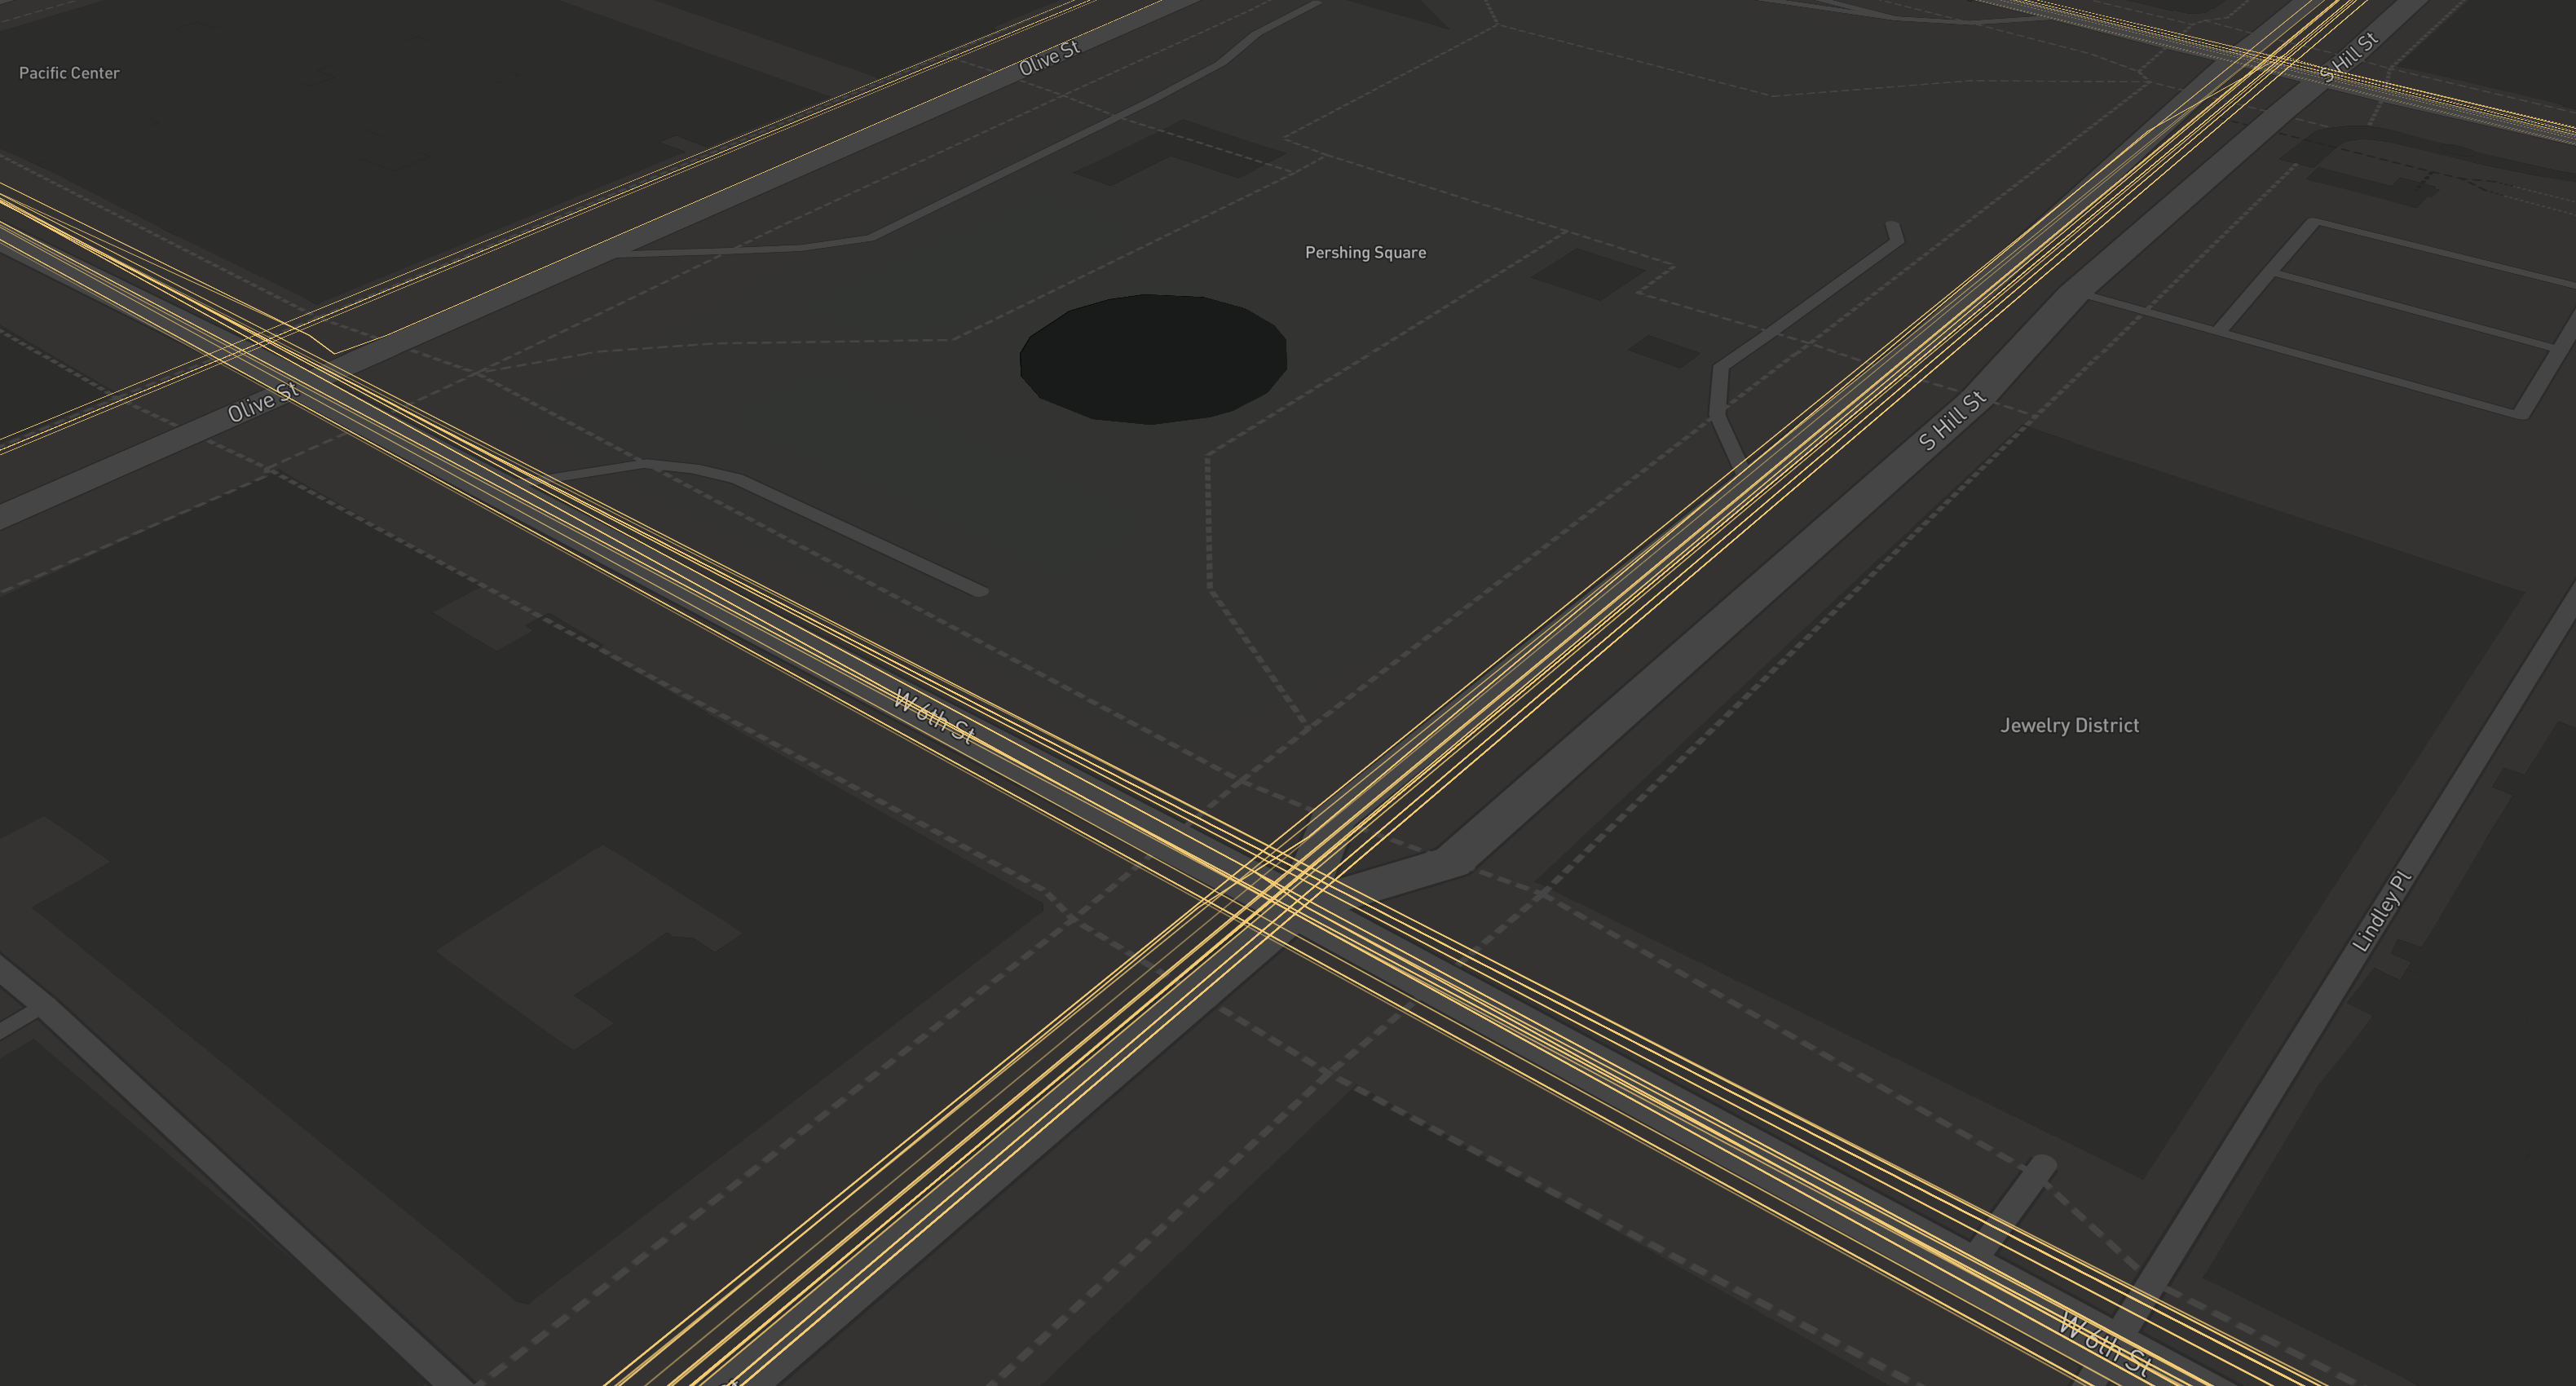
The automatic configurations for tippecanoe is not always 100% perfect. With such a large and complex dataset, simplification may have some undesired effects.
For example, different lines may be simplified in such a way that if you zoom in you will see that now all route path lines end up perfectly aligned with the road centerline or lane centerline such that a “spaghetti” mess of lines can show up along a road at higher zooms:
To tackle this, either decide on retaining higher levels of zoom accuracy (and sacrificing by ending up with a larger file size) or explore other settings in the tippecanoe documentation.